Survey-Aware Self-Training Under Label Scarcity for Low-Hemoglobin Screening in NHANES
DOI:
https://doi.org/10.56705/ijodas.v7i2.517Keywords:
Semi-Supervised Learning, Low Hemoglobin, National Health and Nutrition Examination Survey, Complex Survey Data, Probability CalibrationAbstract
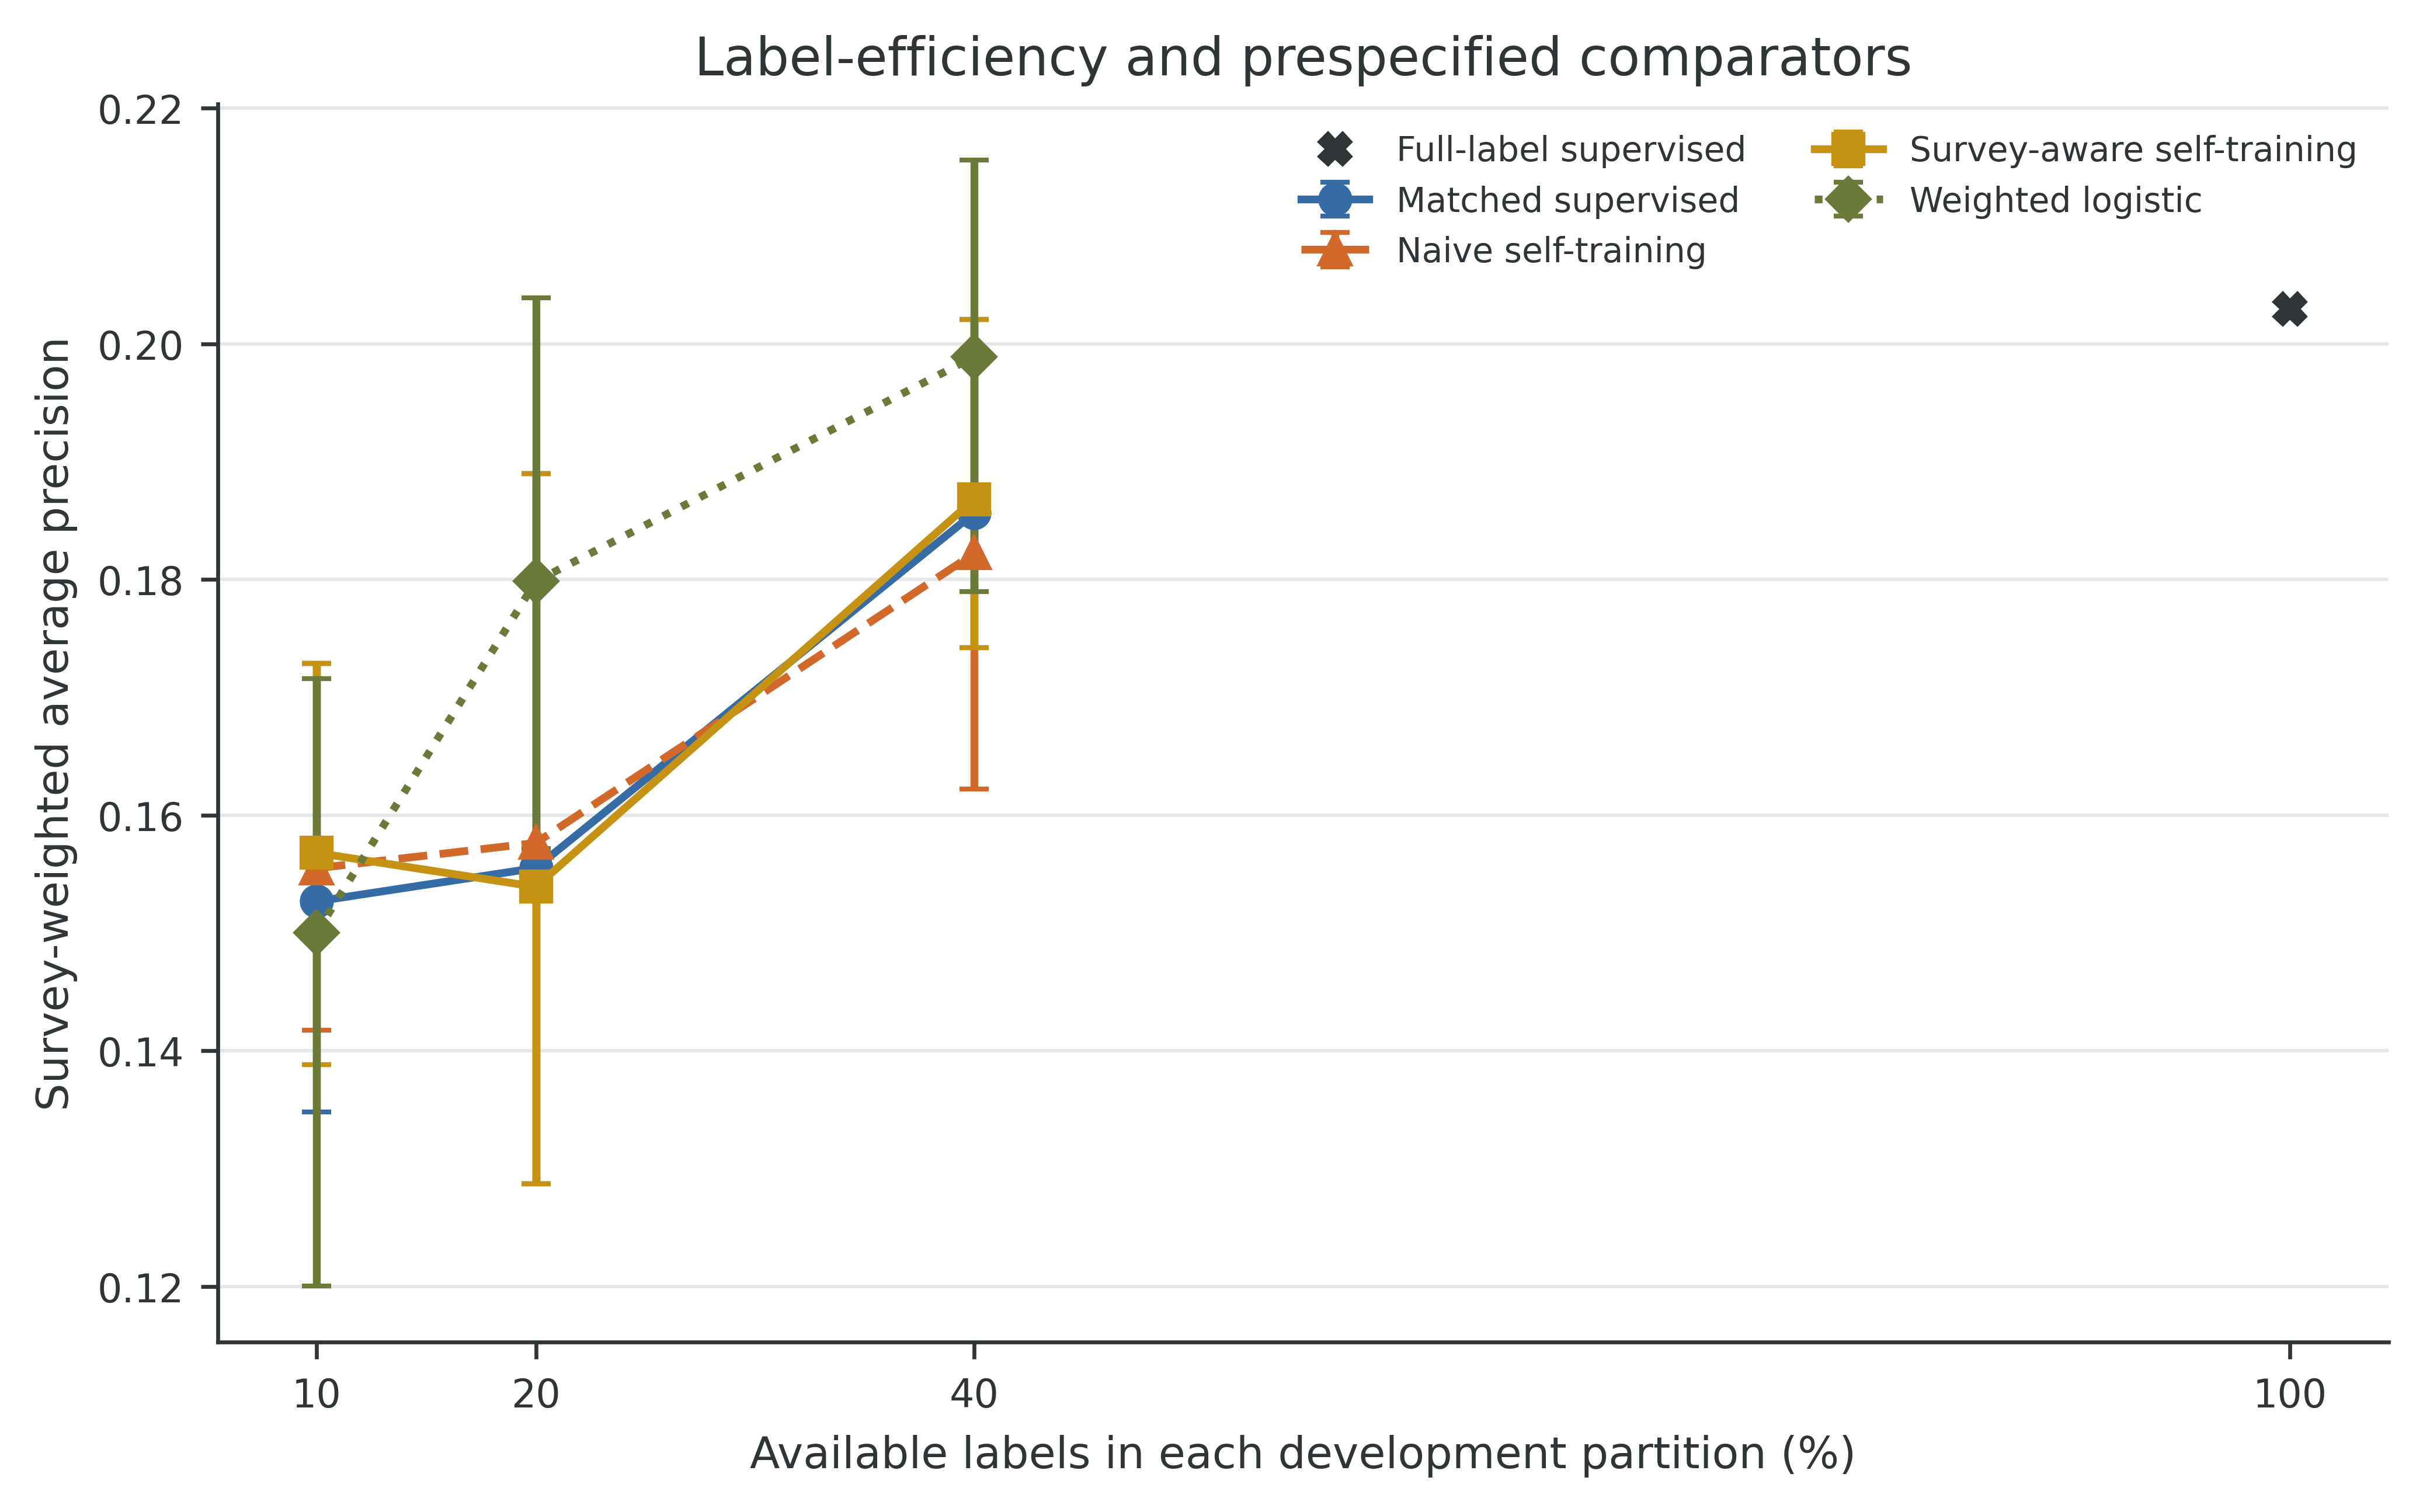
Introduction: Semi-supervised learning may reduce labeled-outcome requirements, but confident pseudo-labels can propagate error. We assessed survey-aware self-training for screening smoking-adjusted low hemoglobin using NHANES August 2021–August 2023. Method: The measured cohort included 5,731 adults, of whom 655 met the outcome definition. Predictors comprised demographic, anthropometric, and blood-pressure measures. Outcomes were deliberately withheld from measured respondents after outcome-stratified splitting and mask construction. Five masks provided each fitted model with 20% of training labels and 20% of validation labels; shared tuning used labels from all five masks. Naturally missing-hemoglobin respondents were reserved for descriptive diagnostics. The primary contrast was survey-weighted test average precision (AP) for self-training minus matched supervised boosting, with a 2,000-replicate design-and-mask bootstrap interval. Results and Discussion: The weighted test prevalence was 0.0990. Mean AP was 0.1555 for supervision and 0.1539 for self-training (difference, -0.0016; 95% CI, -0.0076 to 0.0024). Mean Brier scores were 0.08969 and 0.08986 (difference, 0.00017; 95% CI, -0.00105 to 0.00188). Four masks admitted no pseudo-labels and produced identical predictions; the fifth admitted 258 and reduced AP by 0.0080. Conclusion: The comparison was inconclusive. These findings concern the evaluated boosting and admission rules, and the per-model budgets do not represent the total outcome information used in study design and tuning
Downloads
References
[1] R. Palika, T. Dasi, D. J. Parasannanavar, S. K. Banjara, B. Kulkarni, and R. Pullakhandam, “Machine learning-based prediction of inflammation adjusted iron deficiency anaemia using blood cell indices,” The Indian Journal of Medical Research, vol. 163, no. 4, pp. 469–476, 2026. doi: https://doi.org/10.25259/IJMR_1500_2025.
[2] A. M. Williams, N. Ansai, N. Ahluwalia, and D. T. Nguyen, “Anemia Prevalence: United States, August 2021–August 2023,” National Center for Health Statistics (U.S.), NCHS Data Brief, no. 519, pp. 1–8, 2024. doi: https://doi.org/10.15620/cdc/168890.
[3] World Health Organization, Guideline on haemoglobin cutoffs to define anaemia in individuals and populations. World Health Organization, 2024, ISBN 978-92-4-008854-2. [Online]. Available: https://www.who.int/publications/i/item/9789240088542. [Accessed: Oct. 26, 2026].
[4] S.-R. Pasricha, L. Rogers, F. Branca, and M.-N. Garcia-Casal, “Measuring haemoglobin concentration to define anaemia: WHO guidelines,” The Lancet, vol. 403, no. 10440, pp. 1963–1966, 2024. doi: https://doi.org/10.1016/S0140-6736(24)00502-6.
[5] S. Braat et al., “Haemoglobin thresholds to define anaemia from age 6 months to 65 years: estimates from international data sources,” The Lancet Haematology, vol. 11, no. 4, pp. e253–e264, 2024. doi: https://doi.org/10.1016/S2352-3026(24)00030-9.
[6] S. Pullakhandam and S. McRoy, “Classification and Explanation of Iron Deficiency Anemia from Complete Blood Count Data Using Machine Learning,” BioMedInformatics, vol. 4, no. 1, pp. 661–672, 2024. doi: https://doi.org/10.3390/biomedinformatics4010036.
[7] S. Dutta, I. R. Karkada, P. Sengupta, and S. V. Chinni, “Anthropometric Markers With Specific Cut-Offs Can Predict Anemia Occurrence Among Malaysian Young Adults,” Frontiers in Physiology, vol. 12, Art. no. 731416, 2021. doi: https://doi.org/10.3389/fphys.2021.731416.
[8] Z. Niu, L. Ren, and N. Hu, “Development and temporal validation of a machine learning risk prediction model for anemia in older adults: A NHANES study of an inflammatory–nutritional–renal profile,” Research Square, preprint, 2026. doi: https://doi.org/10.21203/rs.3.rs-9486902/v1.
[9] A. L. Terry, M. M. Chiappa, J. McAllister, D. A. Woodwell, and J. E. Graber, “Plan and Operations of the National Health and Nutrition Examination Survey, August 2021–August 2023,” National Center for Health Statistics (U.S.), Vital and Health Statistics, Series 1, no. 66, 2024. doi: https://doi.org/10.15620/cdc/151927.
[10] National Center for Health Statistics, “Brief Overview of Sample Design, Nonresponse Bias Assessment, and Analytic Guidelines for NHANES August 2021–August 2023,” NHANES Analytic Guidelines, 2024. [Online]. Available: https://wwwn.cdc.gov/nchs/nhanes/continuousnhanes/overviewbrief.aspx?Cycle=2021-2023. [Accessed: Sep. 16, 2026].
[11] National Center for Health Statistics, “Complete Blood Count with 5-Part Differential—Whole Blood (CBC_L),” NHANES Data Documentation, 2024. [Online]. Available: https://wwwn.cdc.gov/Nchs/Data/Nhanes/Public/2021/DataFiles/CBC_L.htm. [Accessed: Sep. 16, 2026].
[12] National Center for Health Statistics, “NHANES Tutorials: Weighting Module,” NHANES Tutorials, n.d. [Online]. Available: https://wwwn.cdc.gov/nchs/nhanes/tutorials/weighting.aspx. [Accessed: Sep. 16, 2026].
[13] Z. Mao, Y. Fukuma, H. Tsukada, and S. Wada, “Risk prediction of chronic diseases with a two-stage semi-supervised clustering method,” Preventive Medicine Reports, vol. 32, Art. no. 102129, 2023. doi: https://doi.org/10.1016/j.pmedr.2023.102129.
[14] J. E. van Engelen and H. H. Hoos, “A survey on semi-supervised learning,” Machine Learning, vol. 109, no. 2, pp. 373–440, 2020. doi: https://doi.org/10.1007/s10994-019-05855-6.
[15] J. Yoon, Y. Zhang, J. Jordon, and M. van der Schaar, “VIME: Extending the Success of Self- and Semi-supervised Learning to Tabular Domain,” in Advances in Neural Information Processing Systems, vol. 33, pp. 11033–11043, 2020. [Online]. Available: https://proceedings.neurips.cc/paper/2020/hash/7d97667a3e056acab9aaf653807b4a03-Abstract.html. [Accessed: Oct. 26, 2026].
[16] A. Oliver, A. Odena, C. Raffel, E. D. Cubuk, and I. Goodfellow, “Realistic Evaluation of Deep Semi-Supervised Learning Algorithms,” in Advances in Neural Information Processing Systems, vol. 31, 2018. [Online]. Available: https://proceedings.neurips.cc/paper/2018/hash/c1fea270c48e8079d8ddf7d06d26ab52-Abstract.html. [Accessed: Oct. 26, 2026].
[17] E. Arazo, D. Ortego, P. Albert, N. E. O'Connor, and K. McGuinness, “Pseudo-Labeling and Confirmation Bias in Deep Semi-Supervised Learning,” in 2020 International Joint Conference on Neural Networks (IJCNN), pp. 1–8, 2020. doi: https://doi.org/10.1109/IJCNN48605.2020.9207304.
[18] J. Wieczorek, C. Guerin, and T. McMahon, “K-fold cross-validation for complex sample surveys,” Stat, vol. 11, no. 1, Art. no. e454, 2022. doi: https://doi.org/10.1002/sta4.454.
[19] N. MacNell et al., “Implementing machine learning methods with complex survey data: Lessons learned on the impacts of accounting sampling weights in gradient boosting,” PLOS ONE, vol. 18, no. 1, Art. no. e0280387, 2023. doi: https://doi.org/10.1371/journal.pone.0280387.
[20] A. S. Wadekar and J. P. Reiter, “Evaluating Binary Outcome Classifiers Estimated from Survey Data,” Epidemiology, vol. 35, no. 6, pp. 805–812, 2024. doi: https://doi.org/10.1097/EDE.0000000000001776.
[21] W. Yao, Z. Li, and B. I. Graubard, “Estimation of ROC curve with complex survey data,” Statistics in Medicine, vol. 34, no. 8, pp. 1293–1303, 2015. doi: https://doi.org/10.1002/sim.6405.
[22] A. Iparragirre, I. Barrio, and I. Arostegui, “Estimation of the ROC curve and the area under it with complex survey data,” Stat, vol. 12, no. 1, Art. no. e635, 2023. doi: https://doi.org/10.1002/sta4.635.
[23] T. Lumley, “Analysis of Complex Survey Samples,” Journal of Statistical Software, vol. 9, no. 8, 2004. doi: https://doi.org/10.18637/jss.v009.i08.
[24] B. Van Calster, D. J. McLernon, M. van Smeden, L. Wynants, and E. W. Steyerberg, “Calibration: the Achilles heel of predictive analytics,” BMC Medicine, vol. 17, no. 1, Art. no. 230, 2019. doi: https://doi.org/10.1186/s12916-019-1466-7.
[25] T. Saito and M. Rehmsmeier, “The Precision-Recall Plot Is More Informative than the ROC Plot When Evaluating Binary Classifiers on Imbalanced Datasets,” PLOS ONE, vol. 10, no. 3, Art. no. e0118432, 2015. doi: https://doi.org/10.1371/journal.pone.0118432.
[26] T. Gneiting and A. E. Raftery, “Strictly Proper Scoring Rules, Prediction, and Estimation,” Journal of the American Statistical Association, vol. 102, no. 477, pp. 359–378, 2007. doi: https://doi.org/10.1198/016214506000001437.
[27] A. J. Vickers and E. B. Elkin, “Decision Curve Analysis: A Novel Method for Evaluating Prediction Models,” Medical Decision Making, vol. 26, no. 6, pp. 565–574, 2006. doi: https://doi.org/10.1177/0272989X06295361.
[28] G. S. Collins et al., “TRIPOD+AI statement: updated guidance for reporting clinical prediction models that use regression or machine learning methods,” BMJ, vol. 385, Art. no. e078378, 2024. doi: https://doi.org/10.1136/bmj-2023-078378.
[29] K. G. M. Moons et al., “PROBAST+AI: an updated quality, risk of bias, and applicability assessment tool for prediction models using regression or artificial intelligence methods,” BMJ, vol. 388, Art. no. e082505, 2025. doi: https://doi.org/10.1136/bmj-2024-082505.
[30] I. Alwiah, U. Zaky, and A. W. Murdiyanto, “Assessing the Predictive Power of Logistic Regression on Liver Disease Prevalence in the Indian Context,” Indonesian Journal of Data and Science, vol. 5, no. 1, pp. 1–7, 2024. doi: https://doi.org/10.56705/ijodas.v5i1.121.
[31] D. Anggreani, Hamdani, Nurmisba, and Lukman, “Grid Search Hyperparameter Analysis in Optimizing The Decision Tree Method for Diabetes Prediction,” Indonesian Journal of Data and Science, vol. 5, no. 3, pp. 190–197, 2024. doi: https://doi.org/10.56705/ijodas.v5i3.190.
[32] D. H. Zulfikar, E. S. J. Atmadji, and W. Wisanti, “Leakage-Aware and Explainable Machine Learning for Healthcare Claim Fraud Detection Using Imbalanced Medical Insurance Data,” International Journal of Artificial Intelligence in Medical Issues, vol. 4, no. 1, pp. 19–34, 2026. [Online]. Available: https://jurnal.yoctobrain.org/index.php/ijaimi/article/view/433. [Accessed: Oct. 26, 2026].
[33] R. Puspitasari, T. Amaliah, and H. Darwis, “Comparative Machine Learning Models for Dementia Prediction Using SMOTE,” International Journal of Artificial Intelligence in Medical Issues, vol. 3, no. 2, pp. 79–90, 2025. doi: https://doi.org/10.56705/ijaimi.v3i2.351.
[34] Purnawansyah, A. P. Wibawa, T. Widiyaningtyas, Haviluddin, H. Darwis, and H. Azis, “An in-depth exploration of supervised and semi-supervised learning on face recognition,” Open Computer Science, vol. 15, no. 1, Art. no. 20250029, 2025. doi: https://doi.org/10.1515/comp-2025-0029.
[35] A. Latip, H. Azis, H. Himawan, and D. A. Kurnia, “SMOTE Technique Utilization in Cirrhosis Classification: A Comparison of Gradient Boosting and XGBoost,” JICO: International Journal of Informatics and Computing, vol. 1, no. 1, pp. 34–40, 2025. [Online]. Available: https://iaico.org/index.php/JICO/article/view/5. [Accessed: Oct. 26, 2026].
[36] N. Rismayanti and S. F. Azzahrah, “Classification of Skin Diseases using Decision Tree Algorithm on an Imbalanced Dataset,” International Journal of Artificial Intelligence in Medical Issues, vol. 2, no. 2, pp. 83–94, 2024. doi: https://doi.org/10.56705/ijaimi.v2i2.155.
[37] F. T. Admojo and N. Rismayanti, “Estimating Obesity Levels Using Decision Trees and K-Fold Cross-Validation: A Study on Eating Habits and Physical Conditions,” Indonesian Journal of Data and Science, vol. 5, no. 1, pp. 37–44, 2024. doi: https://doi.org/10.56705/ijodas.v5i1.126.
[38] J. N. K. Rao and C. F. J. Wu, “Resampling Inference with Complex Survey Data,” Journal of the American Statistical Association, vol. 83, no. 401, pp. 231–241, 1988. doi: https://doi.org/10.1080/01621459.1988.10478591.
[39] J. N. K. Rao, C. F. J. Wu, and K. Yue, “Some Recent Work on Resampling Methods for Complex Surveys,” Survey Methodology, vol. 18, no. 2, pp. 209–217, 1992. [Online]. Available: https://www150.statcan.gc.ca/n1/en/catalogue/12-001-X199200214486. [Accessed: Oct. 26, 2026].
Downloads
Published
Issue
Section
License
Copyright (c) 2026 Irawati Irawati

This work is licensed under a Creative Commons Attribution-NonCommercial 4.0 International License.
Authors retain copyright and full publishing rights to their articles. Upon acceptance, authors grant Indonesian Journal of Data and Science a non-exclusive license to publish the work and to identify itself as the original publisher.
Self-archiving. Authors may deposit the submitted version, accepted manuscript, and version of record in institutional or subject repositories, with citation to the published article and a link to the version of record on the journal website.
Commercial permissions. Uses intended for commercial advantage or monetary compensation are not permitted under CC BY-NC 4.0. For permissions, contact the editorial office at ijodas.journal@gmail.com.
Legacy notice. Some earlier PDFs may display “Copyright © [Journal Name]” or only a CC BY-NC logo without the full license text. To ensure clarity, the authors maintain copyright, and all articles are distributed under CC BY-NC 4.0. Where any discrepancy exists, this policy and the article landing-page license statement prevail.