Interpreting Reactive Species Interdependencies in Plasma-Activated Saline: An Exploratory Multivariate Workflow
DOI:
https://doi.org/10.56705/ijodas.v7i2.417Keywords:
Plasma-Activated Saline, Reactive Oxygen and Nitrogen Species, Multiple Linear Regression, Multicollinearity, Oxidation-Reduction PotentialAbstract
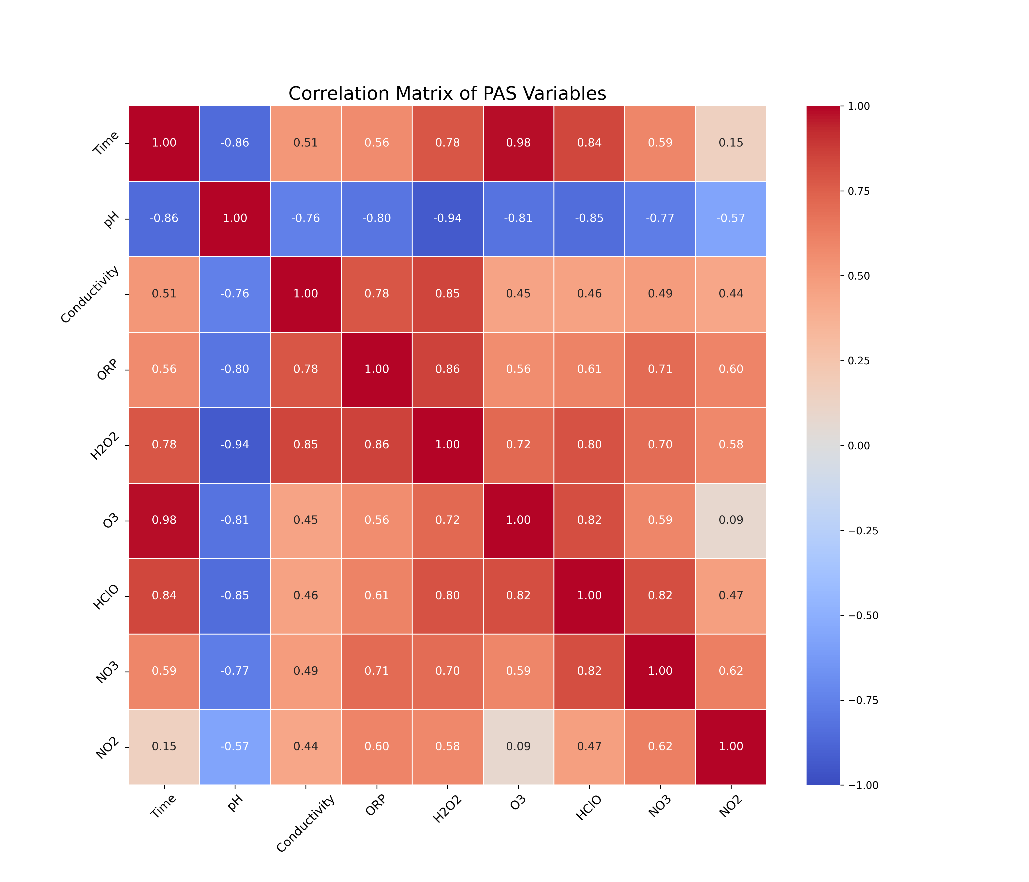
Introduction: Interpreting Plasma-Activated Saline (PAS) is challenging because reactive oxygen, nitrogen, and chlorine species are strongly interdependent, making it difficult to isolate their individual contributions to physicochemical properties such as Oxidation-Reduction Potential (ORP). This study explores these relationships using a multivariate chemometric workflow. Method: A small experimental dataset comprising 10 PAS observations generated by a serial DBD-GAPJ reactor was analyzed using Exploratory Data Analysis and Multiple Linear Regression. ORP was modeled as a function of O3, H2O2, HClO, NO3−, and NO2−. Model interpretation was supported by Variance Inflation Factor analysis, standardized coefficients, Leave-One-Out Cross-Validation, and residual diagnostics. Results and Discussion: H2O2 showed the strongest bivariate correlation with ORP (r = 0.86). The regression model achieved R² = 0.84 and adjusted R² = 0.65, but LOOCV produced Q² = −0.33, indicating poor out-of-sample prediction. Strong multicollinearity among reactive species complicated coefficient interpretation, and none of the individual predictors reached conventional statistical significance. Standardized coefficients identified H2O2 as the strongest relative contributor, while O3 and HClO remained chemically plausible interdependent contributors. Conclusion: The proposed workflow is valuable for interpreting small, collinear chemical datasets, but the results should be regarded as hypothesis-generating rather than predictive, emphasizing the importance of standardization, cross-validation, and multicollinearity diagnostics
Downloads
References
[1] E. Tsoukou, P. Bourke, and D. Boehm, “Efficacy of plasma activated saline in a co-culture infection control model,” Sci. Rep., vol. 12, no. 1, p. 20230, Nov. 2022, doi: https://doi.org/10.1038/s41598-022-20165-z.
[2] S. Kim and C.-H. Kim, “Applications of Plasma-Activated Liquid in the Medical Field,” Biomedicines, vol. 9, no. 11, p. 1700, Nov. 2021, doi: https://doi.org/10.3390/biomedicines9111700.
[3] Y. Jiang et al., “Cold atmospheric plasma-activated saline alleviates secondary injury post-SCI by inhibiting extracellular matrix remodeling and infiltration of proinflammatory macrophages,” Experimental Neurology, vol. 383, p. 115004, Jan. 2025, doi: https://doi.org/10.1016/j.expneurol.2024.115004.
[4] M. Ghasemi, H. Najafzadehvarzi, S. Hassani, and A. Ershadian, “Therapeutic potential of nebulized plasma activated saline (N-PAS) in treating pulmonary infections in rats,” Microbial Pathogenesis, vol. 206, p. 107699, Sep. 2025, doi: https://doi.org/10.1016/j.micpath.2025.107699.
[5] V. Veronico et al., “Anticancer Effects of Plasma-Treated Water Solutions from Clinically Approved Infusion Liquids Supplemented with Organic Molecules,” ACS Omega, vol. 8, no. 37, pp. 33723–33736, 2023, doi: https://doi.org/10.1021/acsomega.3c04061.
[6] V. Jirásek and P. Lukeš, “Formation of reactive chlorine species in saline solution treated by non-equilibrium atmospheric pressure He/O2 plasma jet,” Plasma Sources Sci. Technol., vol. 28, no. 3, 2019, doi: https://doi.org/10.1088/1361-6595/ab0930.
[7] A. Mai-Prochnow et al., “Interactions of plasma-activated water with biofilms: inactivation, dispersal effects and mechanisms of action,” NPJ Biofilms Microbiomes, vol. 7, no. 1, p. 11, Jan. 2021, doi: https://doi.org/10.1038/s41522-020-00180-6.
[8] A. C. Borges et al., “Applications of Cold Atmospheric Pressure Plasma in Dentistry,” Applied Sciences, vol. 11, no. 5, p. 1975, Feb. 2021, doi: https://doi.org/10.3390/app11051975.
[9] T. F. de Melo et al., “Plasma–Saline Water Interaction: A Systematic Review,” Materials, vol. 15, no. 14, p. 4854, Jul. 2022, doi: https://doi.org/10.3390/ma15144854.
[10] S. Xu et al., “Anticancer effects of DBD plasma-activated saline within different discharge modes,” J. Phys. D Appl. Phys., vol. 56, no. 34, p. 345205, Aug. 2023, doi: https://doi.org/10.1088/1361-6463/acd0bb.
[11] N. F. Azevedo Neto et al., “Serial association of dielectric barrier discharge and gliding arc systems: a novel approach for plasma-activated saline production,” J. Phys. D Appl. Phys., vol. 58, no. 1, p. 015202, Jan. 2025, doi: https://doi.org/10.1088/1361-6463/ad800e.
[12] N. F Azevedo Neto, F. S. Miranda, P. W. P Moreira Junior, and R. S. Pessoa, “Influence of gas composition on reactive species generation in plasma-activated saline using two-stage plasma reactors system,” Phys. Scr., vol. 100, no. 7, 2025, doi: https://doi.org/10.1088/1402-4896/adebb9.
[13] K. Sahoo, A. K. Samal, J. Pramanik, and S. K. Pani, “Exploratory data analysis using python,” International Journal of Innovative Technology and Exploring Engineering, vol. 8, no. 12, pp. 4727–4735, 2019, doi: https://doi.org/10.35940/ijitee.L3591.1081219.
[14] A. Bezerra, I. Silva, L. A. Guedes, D. Silva, G. Leitão, and K. Saito, “Extracting value from industrial alarms and events: A data-driven approach based on exploratory data analysis,” Sensors (Switzerland), vol. 19, no. 12, 2019, doi: https://doi.org/10.3390/s19122772.
[15] J. H. Kalivas, “Expanding the Chemometric Data Analysis Toolbox With Immersive Analytics,” Journal of Chemometrics, vol. 39, no. 9, pp. 1–5, Sep. 2025, doi: https://doi.org/10.1002/cem.70060.
[16] T. S. Madssen, A. Smilde, J. Camacho, A. H. Jarmund, J. Westerhuis, and G. F. Giskeødegård, “Statistical Validation of Multivariate Treatment Effects in Longitudinal Study Designs,” Journal of Chemometrics, vol. 39, no. 8, Aug. 2025, doi: https://doi.org/10.1002/cem.70044.
[17] P. C. Austin and E. W. Steyerberg, “The number of subjects per variable required in linear regression analyses,” J. Clin. Epidemiol., vol. 68, no. 6, pp. 627–636, Jun. 2015, doi: https://doi.org/10.1016/j.jclinepi.2014.12.014.
[18] M. L. Waskom, “seaborn : statistical data visualization Statement of need,” vol. 6, pp. 1–4, 2021, doi: https://doi.org/10.21105/joss.03021.
[19] J. Hao and T. K. Ho, “Machine Learning Made Easy: A Review of Scikit-learn Package in Python Programming Language,” Journal of Educational and Behavioral Statistics, vol. 44, no. 3, pp. 348–361, Jun. 2019, doi: https://doi.org/10.3102/1076998619832248.
[20] F. Nelli, Python Data Analytics, 2nd ed. Berkeley, CA: Apress, 2018. doi: https://doi.org/10.1007/978-1-4842-3913-1.
[21] R. M. O’brien, “A Caution Regarding Rules of Thumb for Variance Inflation Factors,” Qual. Quant., vol. 41, no. 5, pp. 673–690, Sep. 2007, doi: https://doi.org/10.1007/s11135-006-9018-6.
[22] P. Filzmoser, B. Liebmann, and K. Varmuza, “Repeated double cross validation,” J. Chemom., vol. 23, no. 4, pp. 160–171, Apr. 2009, doi: https://doi.org/10.1002/cem.1225.
[23] H. J. Kim et al., “Analyses of the Chemical Composition of Plasma-Activated Water and Its Potential Applications for Vaginal Health,” Biomedicines, vol. 11, no. 12, 2023, doi: https://doi.org/10.3390/biomedicines11123121.
[24] J. Ma et al., “Unusual Hypochlorous Acid (HClO) Recognition Mechanism Based on Chlorine–Oxygen Bond (Cl−O) Formation,” Chemistry – A European Journal, vol. 25, no. 29, pp. 7168–7176, May 2019, doi: https://doi.org/10.1002/chem.201806264.
[25] K. M. Yeater, S. E. Duke, and W. E. Riedell, “Multivariate Analysis: Greater Insights into Complex Systems,” Agronomy Journal, vol. 107, no. 2, pp. 799–810, Mar. 2015, doi: https://doi.org/10.2134/agronj14.0017.
[26] Z. C. Liu, L. Guo, D. X. Liu, M. Z. Rong, H. L. Chen, and M. G. Kong, “Chemical Kinetics and Reactive Species in Normal Saline Activated by a Surface Air Discharge,” Plasma Processes and Polymers, vol. 14, no. 4–5, pp. 1–9, 2017, doi: https://doi.org/10.1002/ppap.201600113.
[27] M. S. Siddiqui, “Chlorine-ozone interactions: Formation of chlorate,” Water Research, vol. 30, no. 9, pp. 2160–2170, Sep. 1996, doi: https://doi.org/10.1016/0043-1354(96)00071-1.
[28] A. E. Hoerl and R. W. Kennard, “Ridge Regression: Biased Estimation for Nonorthogonal Problems,” Technometrics, vol. 12, no. 1, pp. 55–67, Feb. 1970, doi: https://doi.org/10.1080/00401706.1970.10488634.
[29] S. Wold, M. Sjöström, and L. Eriksson, “PLS-regression: a basic tool of chemometrics,” Chemometrics and Intelligent Laboratory Systems, vol. 58, no. 2, pp. 109–130, Oct. 2001, doi: https://doi.org/10.1016/S0169-7439(01)00155-1.
[30] A. J. Bard, Standard Potentials in Aqueous Solution, 1st ed. New York: Routledge, 2017. doi: https://doi.org/10.1201/9780203738764.
Downloads
Published
Issue
Section
License
Copyright (c) 2026 Nilton Francelosi Azevedo Neto, Orisson Ponce Gomes, Lucas Pereira Piedade, Felipe Souza Miranda, Rodrigo Savio Pessoa

This work is licensed under a Creative Commons Attribution-NonCommercial 4.0 International License.
Authors retain copyright and full publishing rights to their articles. Upon acceptance, authors grant Indonesian Journal of Data and Science a non-exclusive license to publish the work and to identify itself as the original publisher.
Self-archiving. Authors may deposit the submitted version, accepted manuscript, and version of record in institutional or subject repositories, with citation to the published article and a link to the version of record on the journal website.
Commercial permissions. Uses intended for commercial advantage or monetary compensation are not permitted under CC BY-NC 4.0. For permissions, contact the editorial office at ijodas.journal@gmail.com.
Legacy notice. Some earlier PDFs may display “Copyright © [Journal Name]” or only a CC BY-NC logo without the full license text. To ensure clarity, the authors maintain copyright, and all articles are distributed under CC BY-NC 4.0. Where any discrepancy exists, this policy and the article landing-page license statement prevail.